
Send data to Excel through the DDE interface
Problem scenario:
The lab equipment has an RS232 port, which outputs measurement data every 10 minutes. I want to use parsed values in forms, formulas and my VBA logic in a Microsoft Excel spreadsheet.
Requirements:
- Data Logger Suite Professional, Enterprise, or a trial version;
- DDE Server
It is assumed that:
You can work in Microsoft Excel, specifically create and use forms.
Solution:
Note: This tutorial is based on the previous tutorial named "Serial port data and Excel. Real-time charting". This example will use the parser settings and the data example from this tutorial. Therefore, you may read it before continuing.
Note 2: Office 365 or Office 2019+ may have DDE disabled. You should enable it in the following menu: File → Options →
- Advanced → General → → Ignore other applications that use Dynamic Data Exchange (DDE) → Off.
- Trust Center → Trust Center Settings → External content, set to Enable or Prompt
- Trust Center → Trust Center Settings → External content → Enable Dynamic Data Exchange server lookup → On
The parser is ready. We've tested it in the previous tutorial. If the parser had been correctly set up, then you should see all parser items and their values (fig.1) in the DDE server window below.
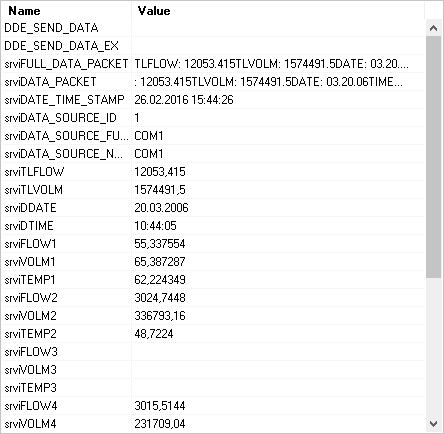
Fig.1. Serial port data, Excel, and DDE. DDE server window.
All parser items are now ready for the usage from Microsoft Excel. The variable name is displayed in the "Name" column. You should know the DDE server name and the topic name to retrieve values via DDE. This information exists on the following page (fig.2 pos.1). Please, note that the server name may be different on your PC.
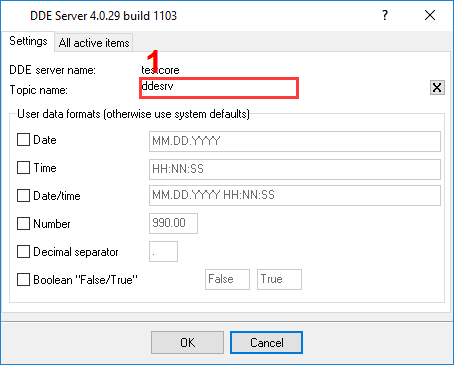
Fig.2. Serial port data, Excel, and DDE. DDE server parameters.
Click the "OK" button and close the DDE Server plugin configuration window and the "OK" button in the options window.
Because we want to draw a chart in a real-time environment, then we should prepare an Excel file before the next step. In this example, we've created a diagram with three plots. Each plot is based on data from columns A, B, or C. We'll place FLOW1, VOLW1, and TEMP1 to a corresponding column, and the chart will be automatically updated every time. We'll use the last 30 values on the diagram only. In this example, we've placed three links to DDE items to cells D21-F21 like "=testcore|ddesrv!srviFLOW1" (w/o quotes) (fig.3 and 4). As you can see, the server name, the topic name, and the variable name are specified in this DDE link.
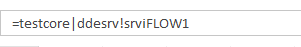
Fig.3. Serial port data, Excel, and DDE. DDE links.
After you've placed the DDE link to the spreadsheet, Microsoft Excel will connect to the data logger and retrieve the data automatically. If the data logger is already started, Microsoft Excel will try to read the existing instance data. If the data logger didn't receive and didn't parse the data yet, Microsoft Excel will display a text about the broken link and read a value after successful parsing.
We are now ready to create a VBA code, which will process the DDE data. This code will copy DDE values to columns, move old values, and add rows to the history list (fig.4, 5).
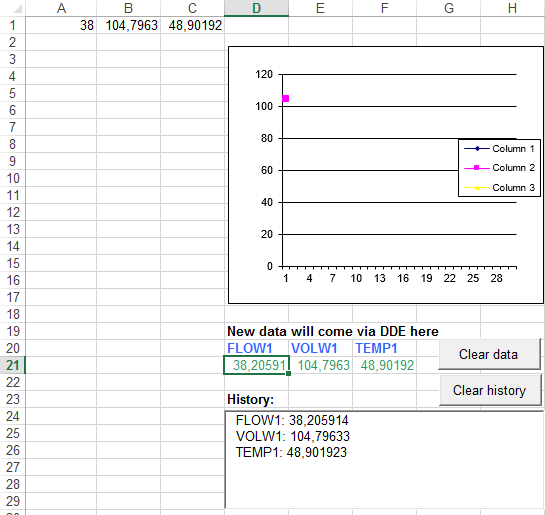
Fig.4. Serial port data, Excel, and DDE. Source spreadsheet.
The figure above contains the following elements:
- The DDE data will be placed here, and it is a source for plots in this example;
- Diagram;
- History list.
VBA code from the Excel file
Private Sub btnClear_Click()
 lbHistory.Clear
 'MsgBox (CStr(Target.Row) + ":" + CStr(Target.Column))
End Sub

Public Sub Process_Value(ByVal X_Coord As Long, ByVal ValueName As String, ByVal Value As Variant)
    Dim TmpValue As Variant
    Dim LastIndex As Long

    ' if we've read and non-numeric value, then replace it by ### in the grid
    If IsNumeric(Value) Then
        TmpValue = Value
    Else
        TmpValue = "####"
    End If

    ' search for an empty cell
    LastIndex = 0
    For I = 1 To 30
        If Cells(I, X_Coord).Value = "" Then
            LastIndex = I
            Exit For
        End If
    Next

    ' if we did not find an empty cell the move old value
    If LastIndex = 0 Then
        LastIndex = 30
        For I = 2 To 30
            Cells(I - 1, X_Coord).Value = Cells(I, X_Coord).Value
        Next
    End If

    ' place new value to the cell
    Cells(LastIndex, X_Coord).Value = TmpValue

    ' add new value to the history list
    lbHistory.AddItem (ValueName + ": " + CStr(TmpValue))

End Sub


Private Sub btnClearData_Click()
    For I = 1 To 30
        Cells(I, 1).Value = ""
        Cells(I, 2).Value = ""
        Cells(I, 3).Value = ""
    Next
End Sub

Private Sub btnClearHistory_Click()
    lbHistory.Clear
End Sub

Private Sub Worksheet_Calculate()
  On Error GoTo ErrHandler
  Application.EnableEvents = False
  Call Process_Value(1, "FLOW1", Cells(21, 4).Value)
  Call Process_Value(2, "VOLW1", Cells(21, 5).Value)
  Call Process_Value(3, "TEMP1", Cells(21, 6).Value)
  Application.EnableEvents = True
ErrHandler:
  Application.EnableEvents = True
End Sub
The Excel file, which we've created you can download here and use it in your work.
OK, all settings have been completed, and we are ready to capture data to an Excel file.
Connect your device and power it on if necessary. Check to see if you can receive a data block from the specified serial port. If the parser had been correctly set up, then you should see all parser items values (Fig.5) in the Excel spreadsheet.
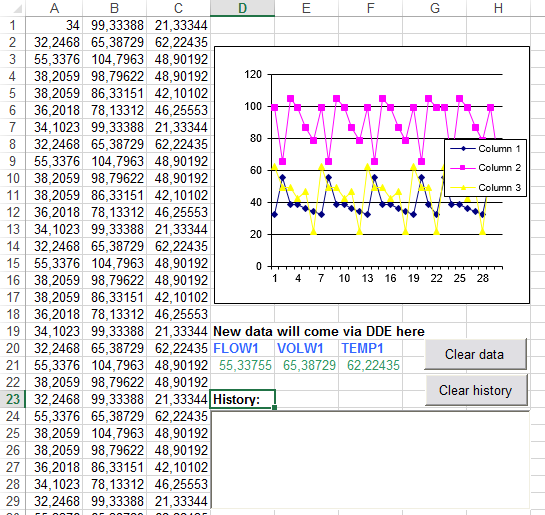
Fig.5 Serial port data, Excel, and DDE. Results.
The figure above contains the following elements:
- Last 30 values of the DDE data;
- Last DDE values;
- DDE data history.
The Excel file with all values and plots you can download here.
This data retrieving method is complex and might prove to be difficult for the unskilled user, but allows you to process the data as you want. Later, you may make the following improvements in this example like:
- Mark some values by color;
- Add date/time stamp to the history list and auto-clear the list;
- Use formulas and calculations.